Oscillatory thermorheology profiling offers rapid and powerful new insights into low-temperature gelation phenomena in engine oils.
Researchers can use the technique to:
- Predict gelation temperatures and gel strengths.
- Potentially predict air-binding and mobility problems
- Help screen Viscosity Index Improvers and other lubricant additives.
The technique exploits the ability of high-performance rheometers to detect the delicate interactions that signify the formation of a gel structure.
Oscillation rheology vs traditional viscometer measurements
Oscillatory measurements enable direct quantification of gel structure, rigidity, and elasticity. In contrast, the standard temperature scanning viscometer method measures viscosity, a liquid property. The viscometer method first damages the very gel structure we wish to observe to liquify the sample, and then measures the viscosity of the resulting liquid. Whilst the scanning viscometer method attempts to minimise disruption by performing the test at a low shear rate of 0.2s-1, the test remains little short of taking a wrecking ball to the gel, when compared to the ultra-delicate oscillatory rheometer approach.
We performed thermorheological profiling on three engine lubricants:
- A “Classic” monograde SAE50 oil
- An SAE 15W-40 multigrade mineral oil, and
- An SAE 5W-30 Multigrade synthetic oil
Oscillatory rheology measurements observe the response of a sample to gentle applied perturbations. The test entails the application of small amplitude sinusoidal stresses to the sample whilst observing its resulting deformation.

The magnitude of deformation, the strain, under the applied stress reveals the resistance to deformation, the modulus, of the sample.
As gelation proceeds the assembly of an interconnected gel structure results in an elastic response that is signified by strain starting to track the applied stress – in other words, they become increasingly in-phase with each other. In simple terms, when you prod a jelly it deforms and when you remove the applied force it bounces back.
Rheology properties for lubricant gelation
We can quantify two metrics that describe the sample’s condition:
- Storage modulus (symbol G’ and units of Pascals, Pa) is a measure of that component of the resistance to deformation that is due to solid-like (i.e. gel) behaviour
- Phase angle (symbol δ and units of degrees, °) is a measure of the relative dominance of solid-like vs liquid-like behaviour in a sample. A phase angle of 0° signifies a completely elastic response to applied stress (complete “bounce-back-ability”) and a phase angle of 90° demonstrates a completely viscous, i.e. liquid-like, response.
Sample size for each test was around 2ml. For this study a relatively rapid cooling rate of 2°C per minute was adopted, resulting in a total test time of just 40 minutes. The small sample size, high-performance temperature control and low-mass measuring surfaces enable such rapid cooling rates. However, longer cooling profiles can be easily employed.
The following results were obtained for the three oils:
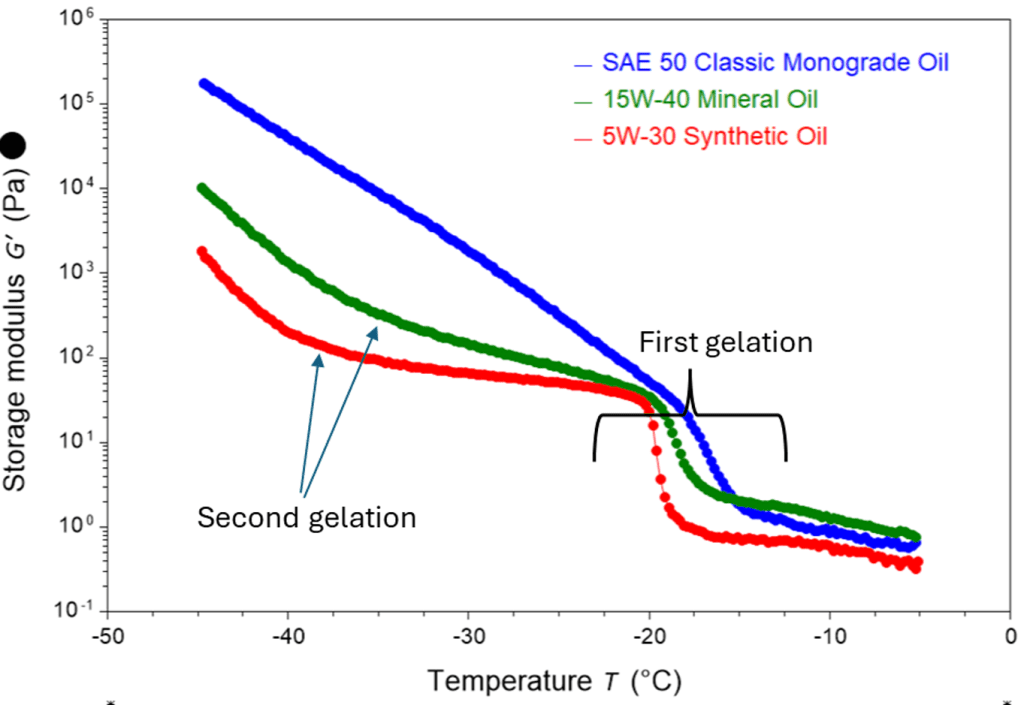
All three oils show the ongoing assembly of a gel structure throughout the gelation process, with storage modulus increasing and phase angle tending downwards towards an elastic-dominant, solid-like behaviour.
The storage modulus vs temperature plots clearly show the enormous magnitude of growth of rigidity across the temperature range, with, for example, the Classic Monograde oil showing nearly 300000 X increase in modulus across the range. It is worth noting that the ability to capture this in full is testament to the sensitivity of a high-performance rheometer. A typical Brookfield-type viscometer could only capture at best a 10 X increase in viscosity within the working range of the instrument and spindle set.
One major benefit such a wide operating window offers is that it sheds light on the nature of the continuing gelation processes that occur at even lower temperatures, with distinct commencement of such processes for the mineral and synthetic oil samples and an ongoing steady gelation for the monograde sample.
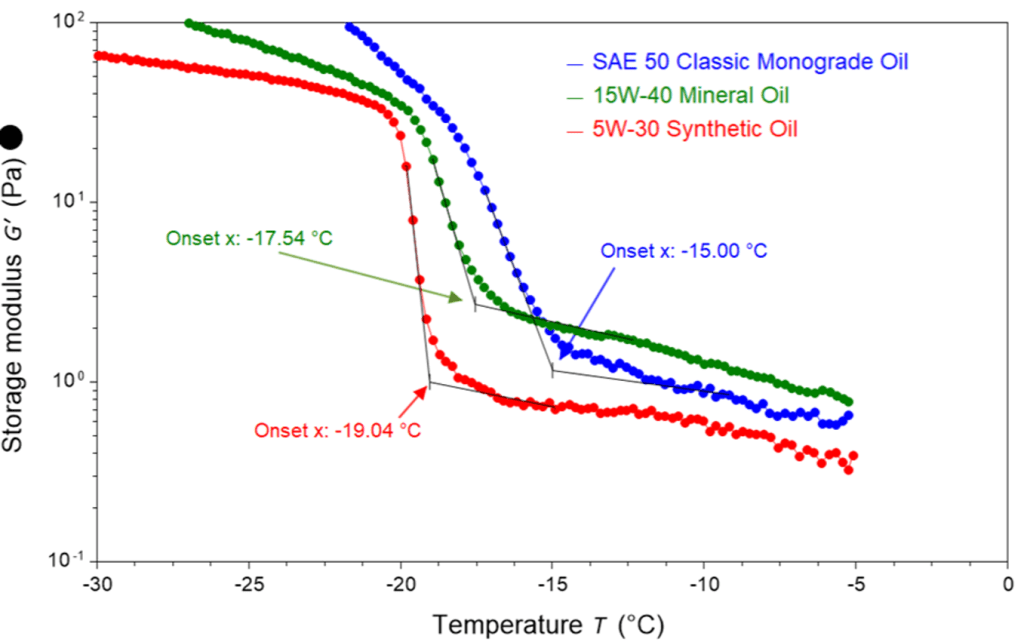
The range of first-gelation onset temperatures for the three samples can be clearly quantified.
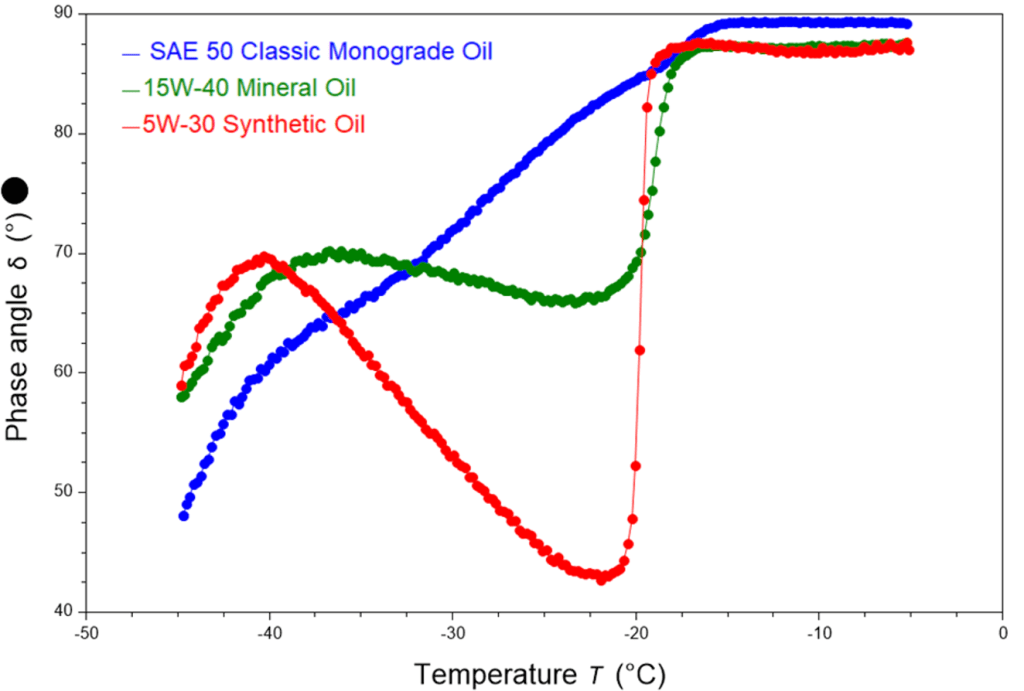
The phase angle vs temperature plots reveal the wide variation in the gelation processes between the samples, with the synthetic oil undergoing a cliff-edge, rapid onset gelation down into an elastic-dominant condition (phase angle < 45°) at -20°C, the mineral oil showing similar but less extreme gelation and the monograde sample showing the onset of a gradual gelation below -15°C.
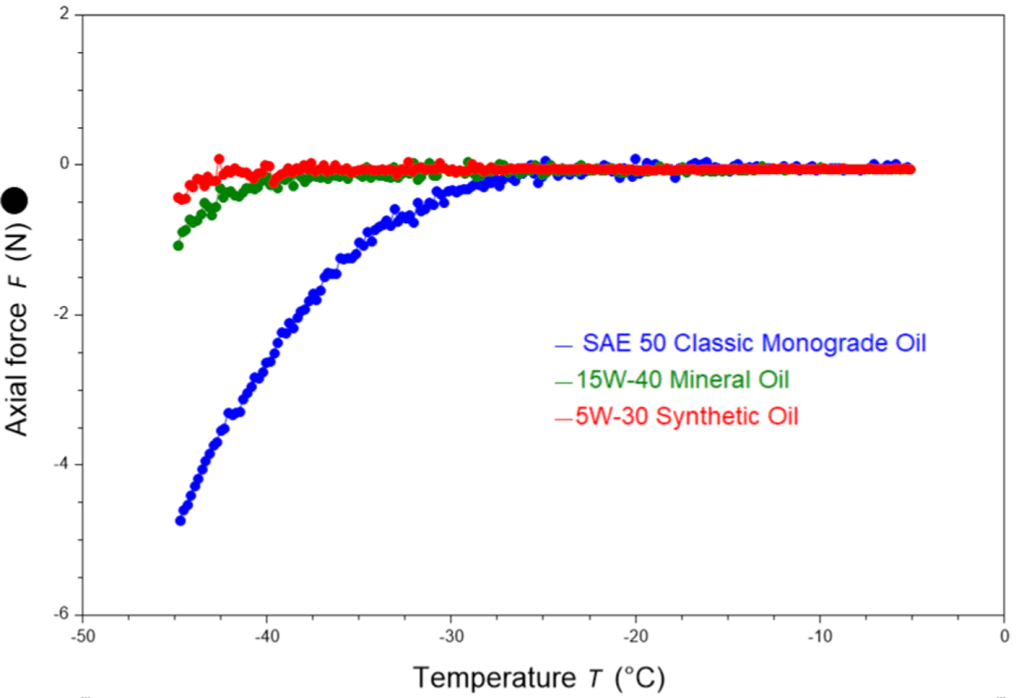
Lubricant shrinkage on gelation – A potential warning flag for air-binding?
One potentially valuable and unique insight that these tests may offer is the ability to compare the shrinkage of gelled lubricants as they cool. The plot below shows the “tug” of the shrinking sample, trying to pull the plates of the rheometer together as it does so. The Monograde Oil shows a much larger pull than the other two samples, revealing it is shrinking far more.
Shrinkage may impact on the interaction and adhesion of lubricants with mechanical surfaces and it is hypothesised that the detachment of gelled lubricant from surfaces may contribute to air-binding and lubricant starvation problems.
In summary, rheology profiling offers a powerful set of tools for researchers formulating finished lubricants or working with lubricant additives. Metrics such as storage modulus and phase angle provide direct observations of gelation and potentially-detrimental gel shrinkage can be observed.
If you would like us to characterise your lubricants or additives please get in touch.