Dynamic surface rheology is a technique that can be used to monitor the formation of films, or drying on the surface, of a bulk material. In this case study, we used dynamic surface rheology to monitor the physical drying behaviour of cosmetic foundations, alongside drop-shape analysis to monitor hydrophilicity of a cosmetic foundation formulation. Interesting behavioural differences between water-based and silicone-based formulations were identified, which may be useful to Research and Development specialists when designing new products or devising new techniques for monitoring the long-wear properties of a particular product.
Contact us to arrange a lab tour and discuss rheological techniques with our experts
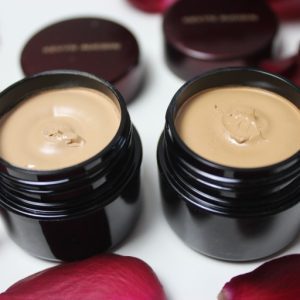 Cosmetic foundations are usually a powder, liquid or cream and are applied to the skin to even skin-tone and cover blemishes. This is usually before application of other cosmetic items such as blusher, eye shadow or lipstick. Some foundations, as well as providing an even coverage, contain SPF or moisturisers.
Cosmetic foundations: A brief history
Cosmetic foundations have been used throughout the ages. For example, the Ancient Greeks used to apply lead powder or chalk and the Elizabethans used to apply ceruse, a highly toxic mixture of vinegar and lead, to lighten their complexion and in the 18th century Louis XV encouraged the wearing of lead-based make-up by men.
Modern day foundations are less toxic than the original lead-based formulations, and there is a range of products to suit every skin-type. Common formulations can be oil-based, powder-based, water-based, mineral-based or silicone-based. Each base has a particular set of characteristics that sets it apart, for example silicone-based foundations are considered lightweight and supple therefore allowing the product to move with the face, whereas water-based foundations provide medium coverage with a creamy texture that is less heavy than oil-based formulations.
Dynamic surface rheology for benchmarking film formers for cosmetics
Monitoring the formation of a film on the foundation over time can be a useful proxy for investigation of a foundation’s behaviour on the face. Properties such as complex modulus (to see how rigid the sample is), tan delta (to see if the samples are liquid- or solid-dominant) and yield stress (once the film is formed, how much stress is required to break the film) can all provide quantifiable insights into behaviour and can be used as a benchmarking tool for comparing one product or formulation against another.
Film formation can be monitored using dynamic surface rheology, which is complementary to ‘traditional’ bulk rheology. Within a dynamic surface rheology measurement, the sample is loaded into a trough and a ring geometry is lowered onto the surface of the sample so it is just in contact. The sample is not enclosed and is fully open to the atmosphere, therefore drying through evaporation is enabled.
This is in contrast to bulk rheology, where a sample is placed between two plates and the behaviour of the whole sample is measured. In bulk rheology the sample is enclosed, therefore curing due to evaporation or solvent losses are not possible. This means that the parameters measured reflect the material in the centre of a sample, rather than areas of the sample that are open to the atmosphere, for example at the edge.
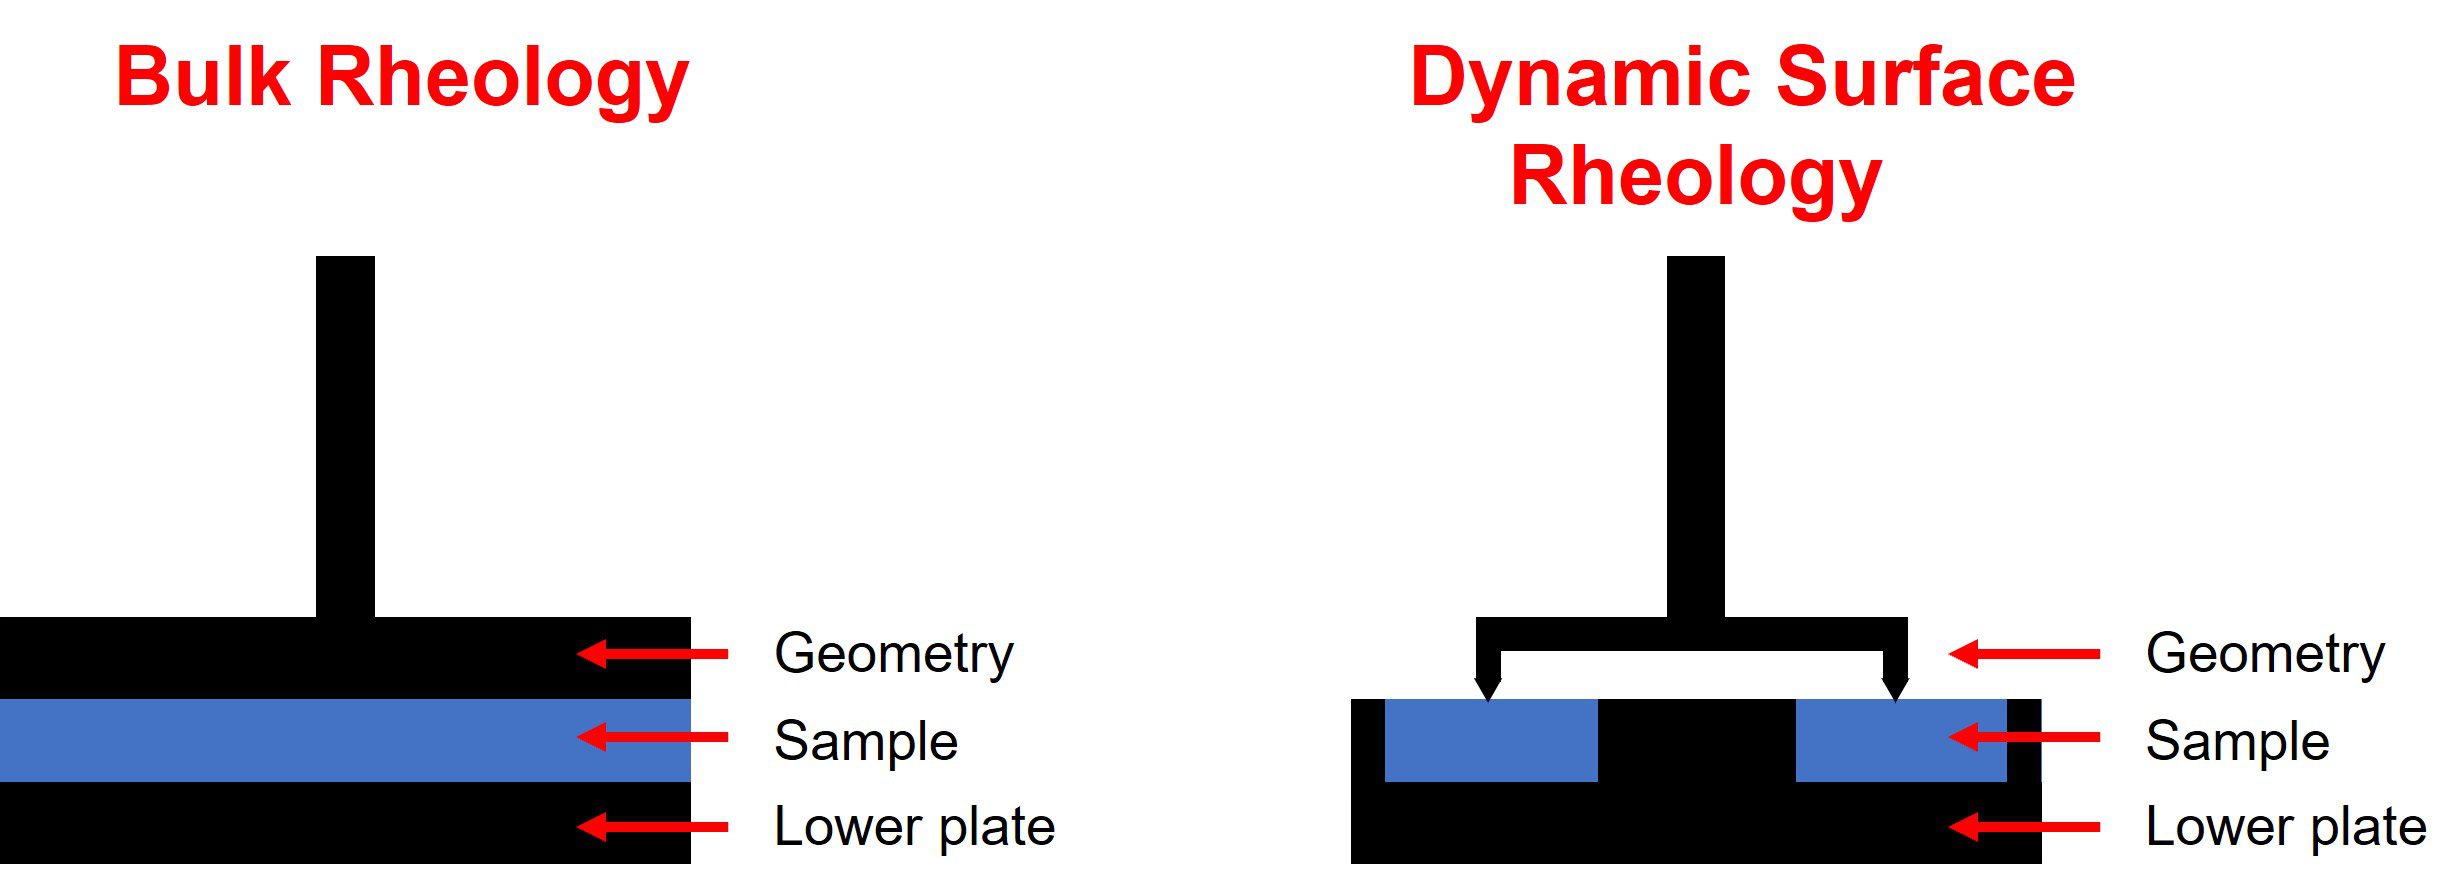
Dynamic surface rheology was used to investigate the drying behaviour of cosmetic foundations over time, and then investigate the strength of the surface formed after a pre-determined time-frame.
- Sample A – water-based, marketed as mattifying
- Sample B – water/silicone-based, marketed as hydrating
- Sample C – water/silicone-based, marketed as oil-free
- Sample D – silicone-based, marketed as mattifying
All foundation samples were loaded into the base-geometry such that the minimum volume of foundation to fill the well was used. The dynamic surface rheometry attachmen was then lowered so it was just in contact with the surface. In all cases the base-plate was heated to 37 °C and the samples were open to the air i.e. covers were not used.
Behaviour change over time
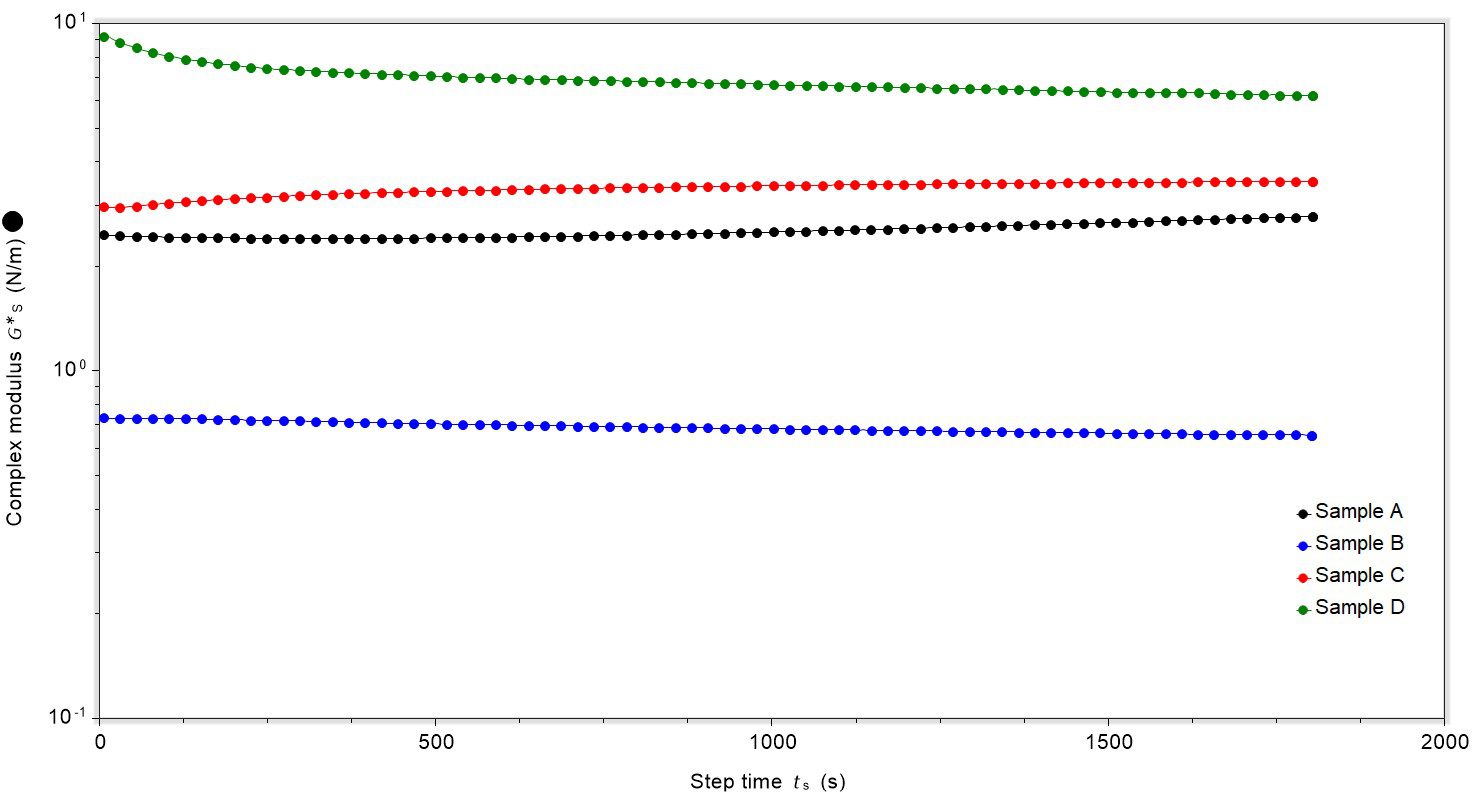
As the foundation cured over time, monitoring the complex modulus allowed for interrogation of the rigidity of the surface of the material, Figure 1. For all samples, the oscillation strain and frequency were maintained at constant amplitude throughout. The complex modulus of Sample B stayed constant over the duration of the experiment, whereas the complex modulus of Samples A and C increased slightly. Sample D was the outlier, as in the initial stages of the experiment the complex modulus dropped showing a decrease in rigidity, but after this initial fall it stayed constant.
Considering the tan delta (δ) value change over time can provide insight into the dominance of liquid-like or solid-like behaviour and gives more detailed information than consideration of the complex modulus alone. Tan δ can be determined using the original experimental data and is calculated by dividing the loss modulus (G’’) by the storage modulus (G’):
Tan δ = G’’/G’
If tan δ has a value of over 1, the behaviour is liquid-dominant and if tan δ has a value of below 1, the behaviour is solid-dominant. When tan δ equals 1 the storage and loss moduli are equivalent, i.e. this is the point at which the storage and loss moduli cross.
Change in tan δ value over time shows behavioural differences
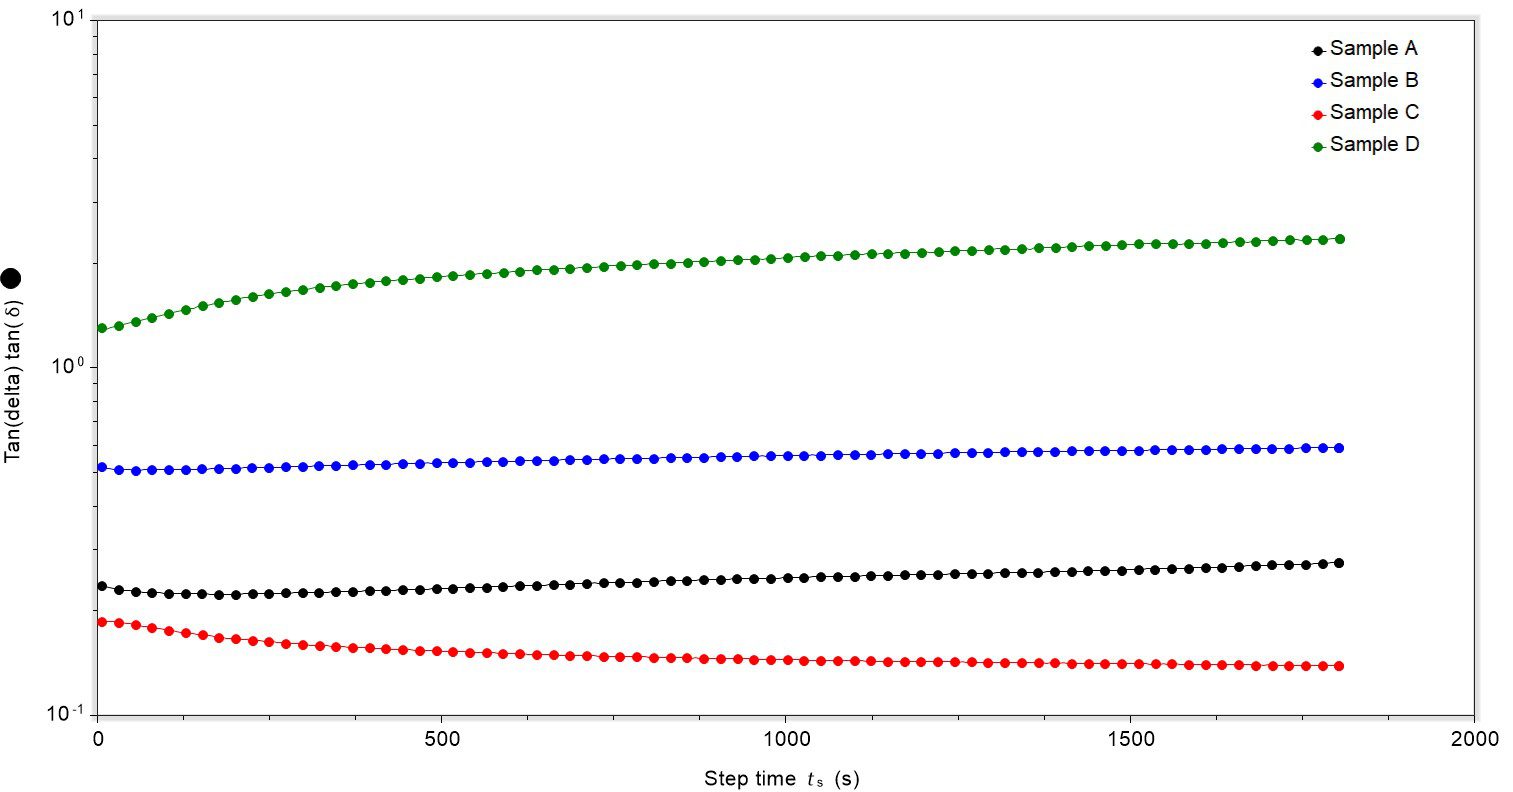
With the foundations studied, tan δ data revealed some interesting differences between the samples, Figure 2. Samples A, B and C were all solid-dominant in behaviour at the strain and frequency used during the experiment, shown by the tan δ value of less than 1. The sample with the largest difference in magnitude of storage and loss modulus was Sample C, shown by the smallest tan δ value. The difference in magnitude between storage and loss modulus initially increased over the first 250 seconds (shown by the slight decrease in tan δ value in Sample C), and then stayed constant.
Samples A and B were also solid-dominant, with Sample A having a smaller tan δ value than sample B. However, the difference between the magnitude of storage and loss modulus in either sample did not change as the experiment progressed and the tan δ value remained constant. The outlier was Sample D, which was liquid-dominant at the strain and frequency used during the experiment; a stark contrast to the formulations containing water as a dominant phase.
Interestingly, the degree of liquid-dominance increased significantly over the first 250 seconds of the experiment and then continued to climb but at a much slower rate. Although Sample D is an outlier, the fact that sample D is liquid-dominant under the conditions of this test suggest that Sample D may be able to flow and adapt to facial movement better than the other formulations tested. This might lead to a feeling of suppleness or ‘lightness’ in the product.
Testing the strength of the film formed
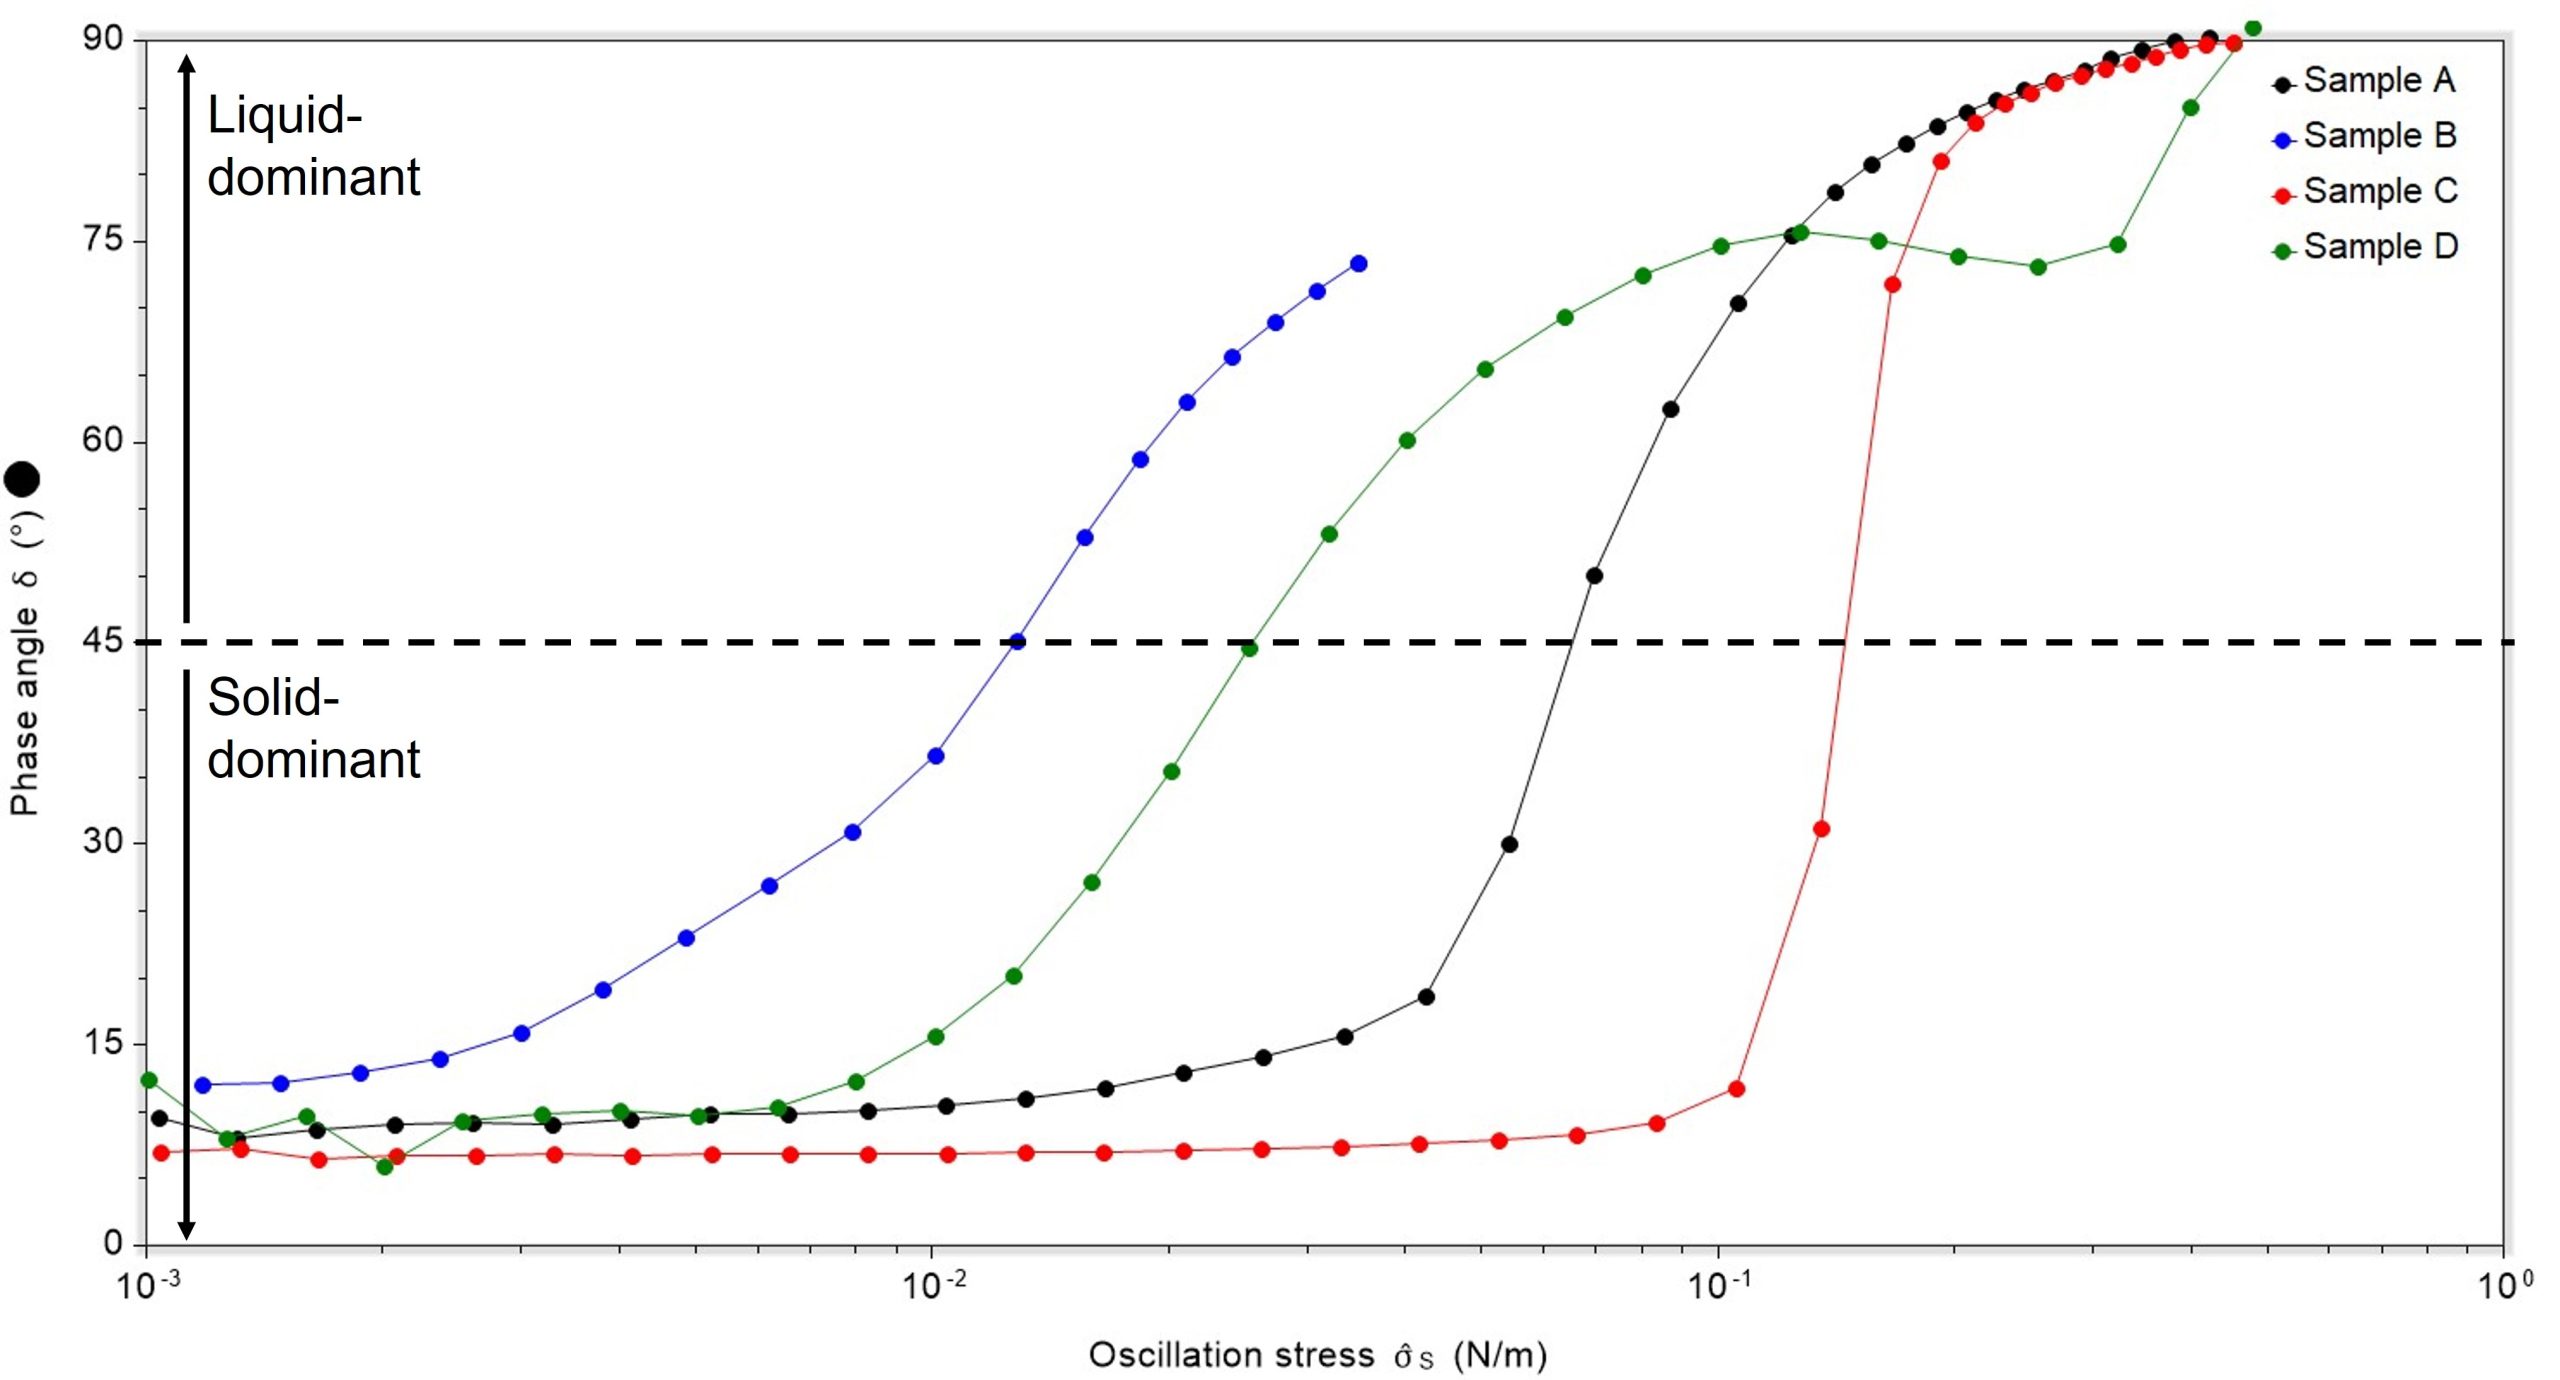
After the samples had been allowed to dry for 30 minutes, the strength of the surface was tested. The samples were oscillated at increasing stress amplitude whilst the same frequency was maintained. Phase angle data is a useful way to visually show the difference in yield stress between samples and the change in behaviour prior to, or after, yielding. A phase angle below 45° shows solid dominance, and above 45° shows liquid dominance. The yield point can either be taken as the point at which the sample starts to change behaviour (i.e. the curve starts to deviate from the plateau), or the stress when the phase angle is 45°; the latter is akin to the cross-over point of the storage and loss moduli. Considering the phase angle data, it can be clearly observed that sample B requires the least stress to induce a change in behaviour and sample C requires the most, Figure 3. This is interesting, as it suggests that sample B may be more easily rubbed off the face compared to Samples A, C and D.
Contact angle to probe surface behaviour
The final experiment completed was a comparison of the contact-angle behaviour of water on the surface of a film of the foundation and a film of the foundation treated with a lasting-fix spray. The rationale behind this experiment was that the contact angle of water would provide information relating to the hydrophobicity or hydrophilicity of the surface, which may translate into long-wear data.

Contact angles can range from 0 to 180 degrees. When using water, if the contact angle is less than 90 degrees the material can be described as hydrophilic and if it is between 90 degrees and 180 degrees the material can be described as hydrophobic. Usually, the lower the contact angle the better the wettability of the material under study. Contact angles are determined by the energetic interaction between the liquid and the surface, therefore it is possible to use the contact angle of a range of known liquids to determine the surface energy or characteristics of an unknown, or newly developed, material.
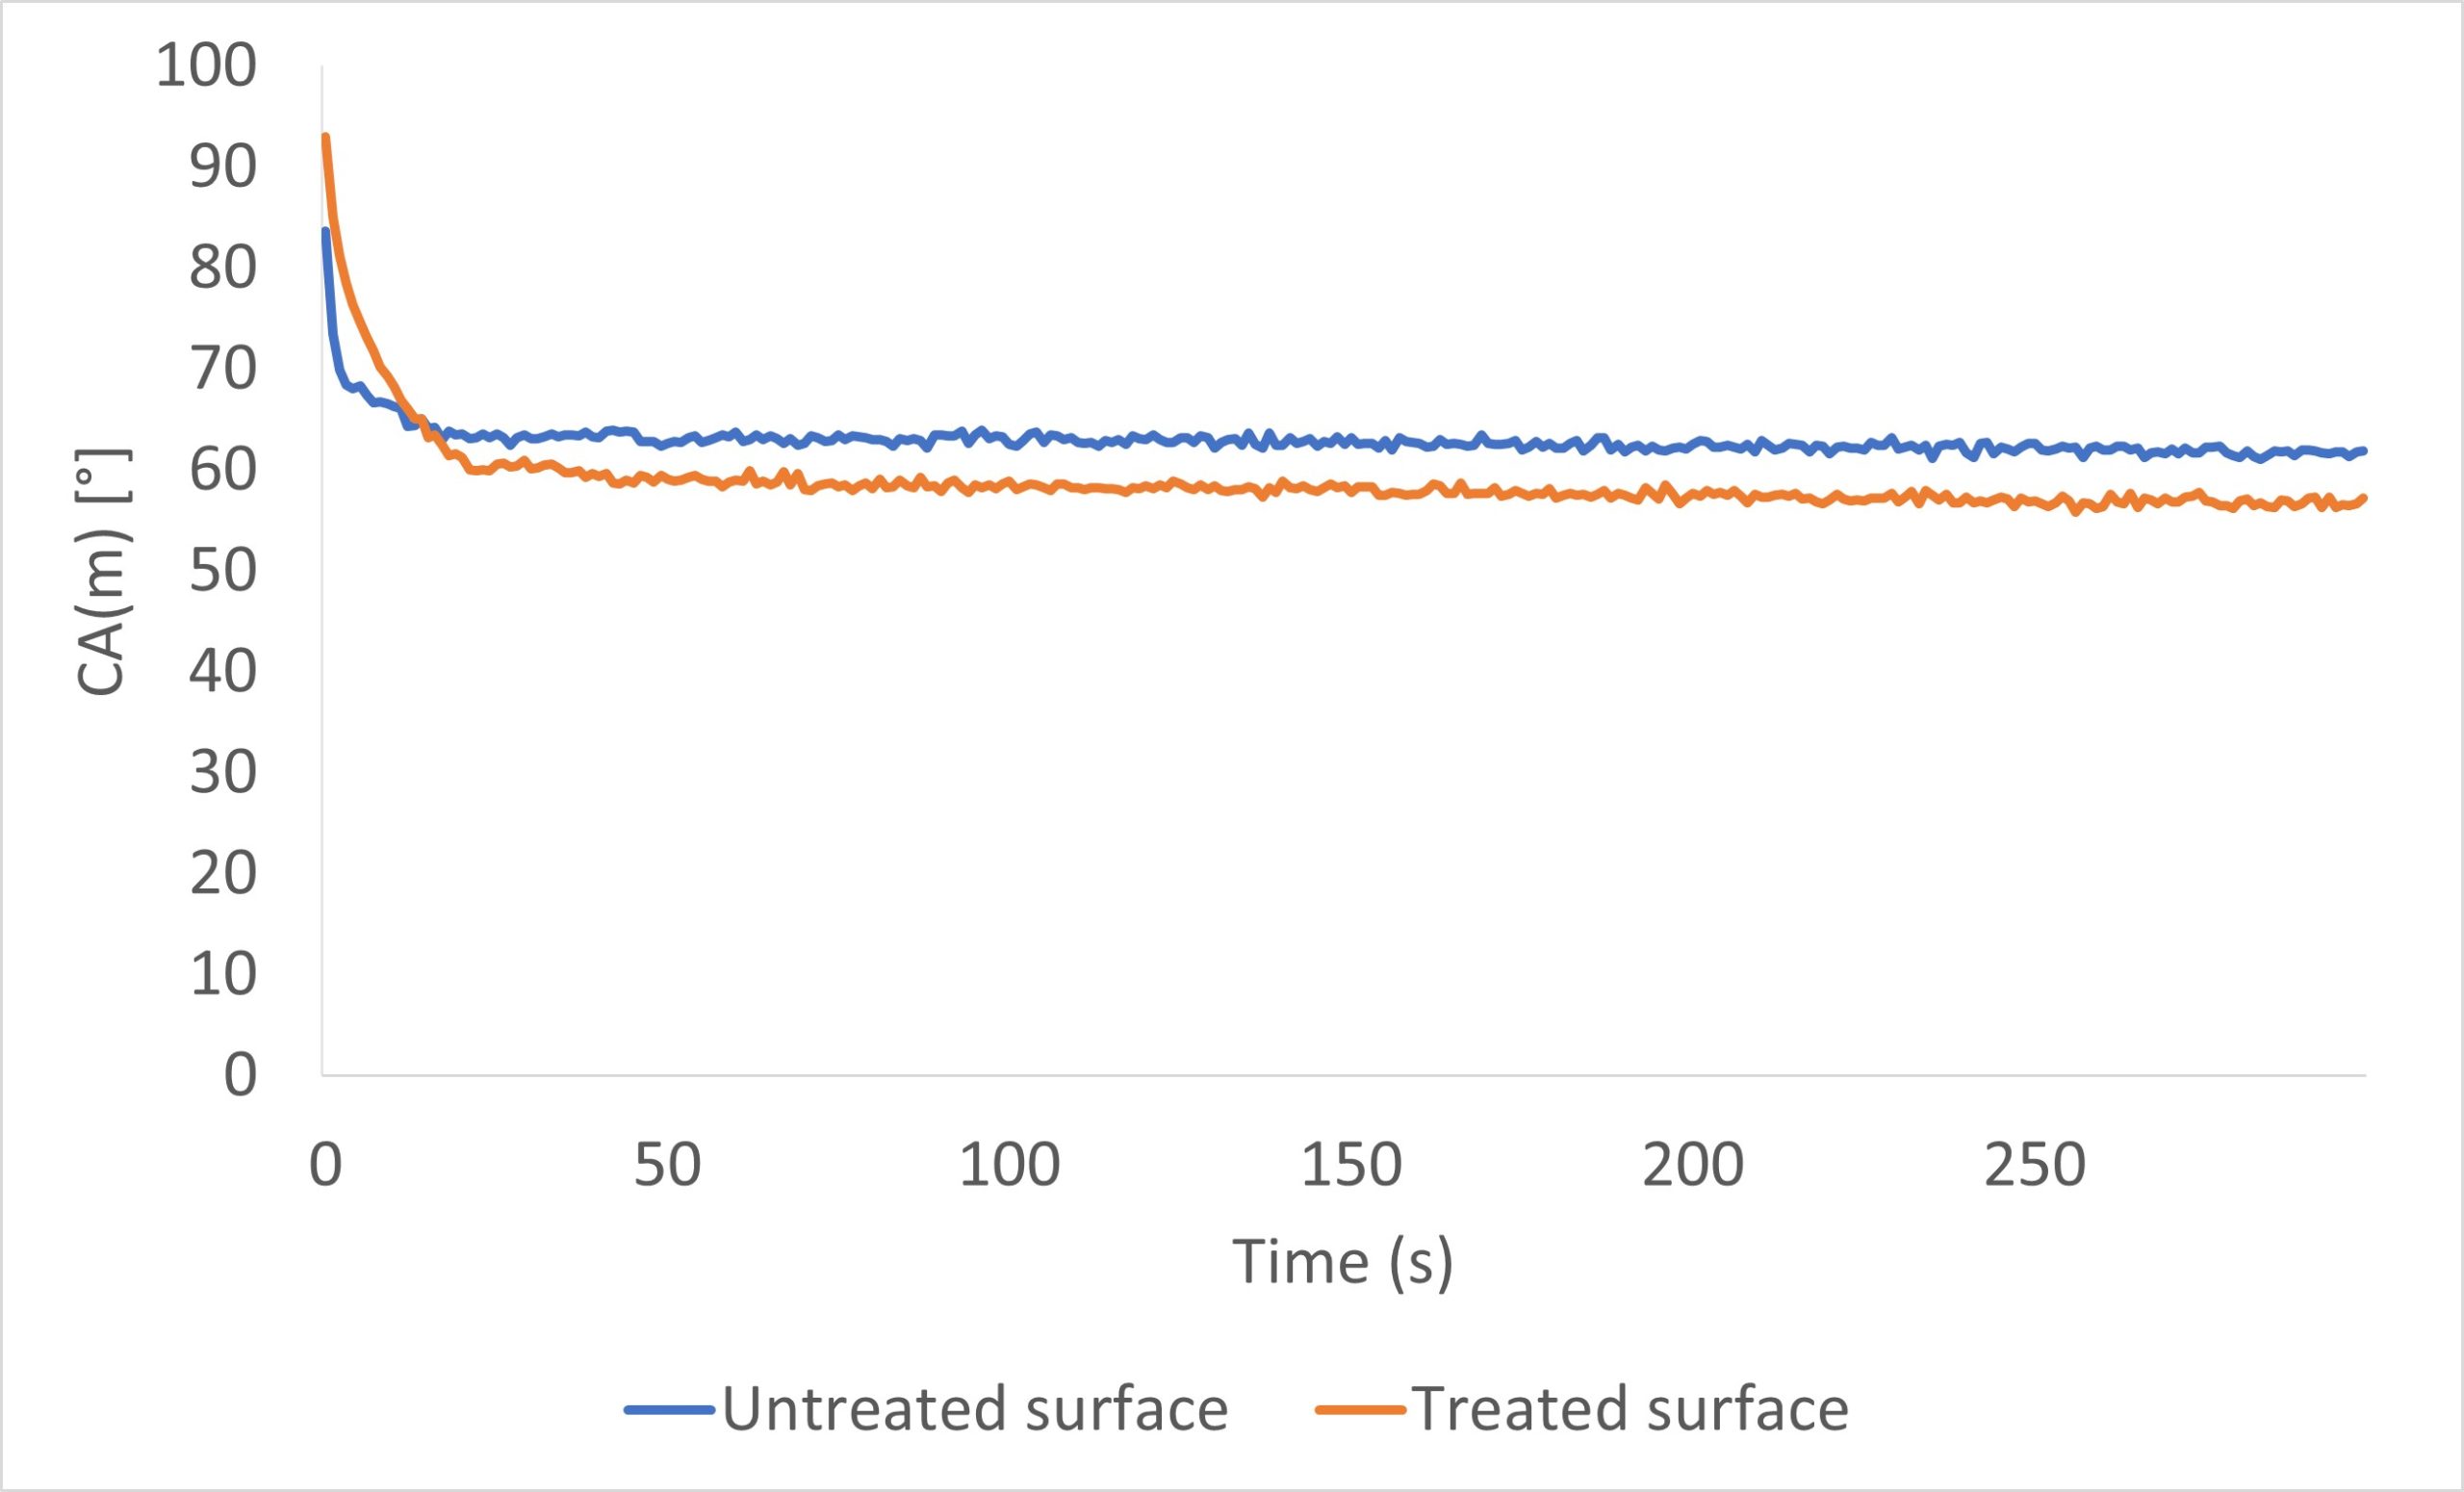
The sample subjected to contact angle analysis was Sample A. One water droplet was deposited onto the surface of a foundation film (500 microns in thickness) and the droplet’s behaviour monitored. Upon initial deposition there was a short relaxation period of 17 seconds, where the droplet wetted onto the surface and the contact angle rapidly decreased, Figure 4. After this time the contact angle stabilised at approximately 63.4° and remained constant for the remainder of the experiment.
The second experiment was to look at the contact angle of water on the surface of the foundation treated with a lasting-fix spray. These sprays are designed to increase the longevity of a make-up product and could feasibly have an impact upon the polarity of the surface and therefore the contact angle measurement. In analogy with the non-treated surface, there was again a short relaxation period of approximately 25 seconds, directly after the droplet was applied to the surface. After this time the contact angle stabilised at approximately 57.6°. This shows that the lasting-fix spray increased the hydrophilicity of the surface.
Key findings and summary
To conclude, both dynamic surface rheology and drop shape analysis have been used to probe the behaviour of foundations. Key findings are:
- The rigidity of the samples stayed fairly constant over the duration of the experiment. In this experiment, the siloxane-based sample (D) was more rigid than the water-based (A) and siloxane/water formulations (B and C). One interpretation is that Sample D is thicker and may provide better coverage than the other samples.
- The tan δ values showed that the siloxane-based sample (D) was liquid-dominant at the frequency and strain amplitude in our test, whereas the water-based (A) and siloxane/water formulations (B and C) were both solid-dominant during testing. This could be used as evidence that silicone-based formulations are more supple than water-based formulations, so can flow and move to adjust to facial movement.
- Phase angle data show that the siloxane/water-containing samples (B and C) had both the highest and lowest yield stress of the samples tested. The foundation with the higher yield stress may rub off the face less easily than the sample with the lower yield stress.
- The water-based sample (A) was, unsurprisingly, hydrophilic according to surface contact angles. Treatment with a lasting-fix spray increased the hydrophilicity, decreasing the contact angle further.
The example showcased here has clear application within the cosmetics industry, particularly in relation to predicting long-wear and the ease of application and removal of the product.
If you would like to arrange a discussion about how our characterisation capabilities can help you, please feel welcome to contact us.
